The Charlottesville Regional Equity Atlas is a hub for the regional equity work done in partnership with local civic and community organizations. The data-driven reports and dashboards included in the Equity Atlas document progress toward measures of well-being to advance a more equitable community and help citizens hold decision-makers accountable.
Visit the Equity Atlas's online platform
Dashboards and Reports Featured in the Equity Atlas
resource
Feb 29, 2024
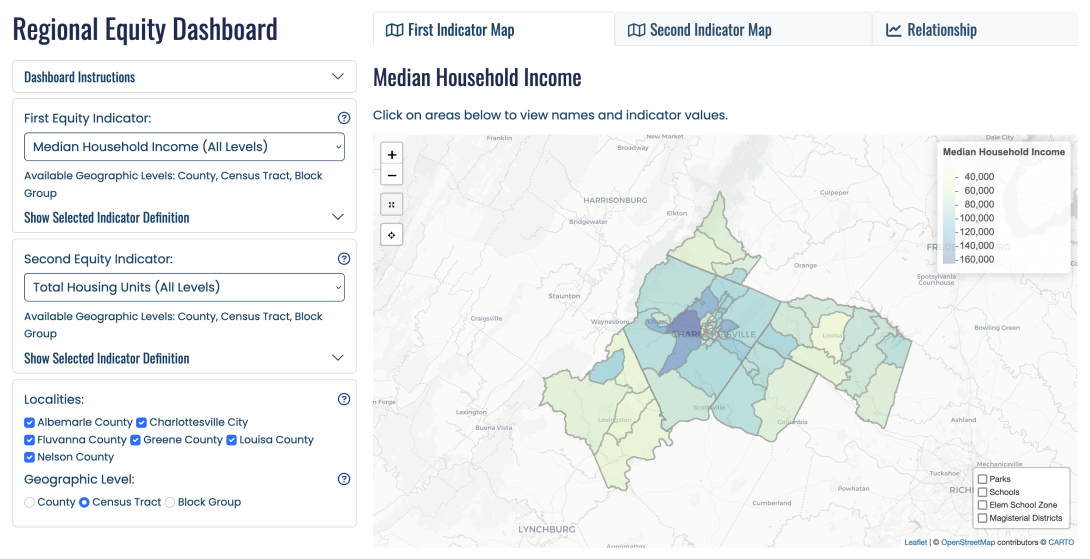
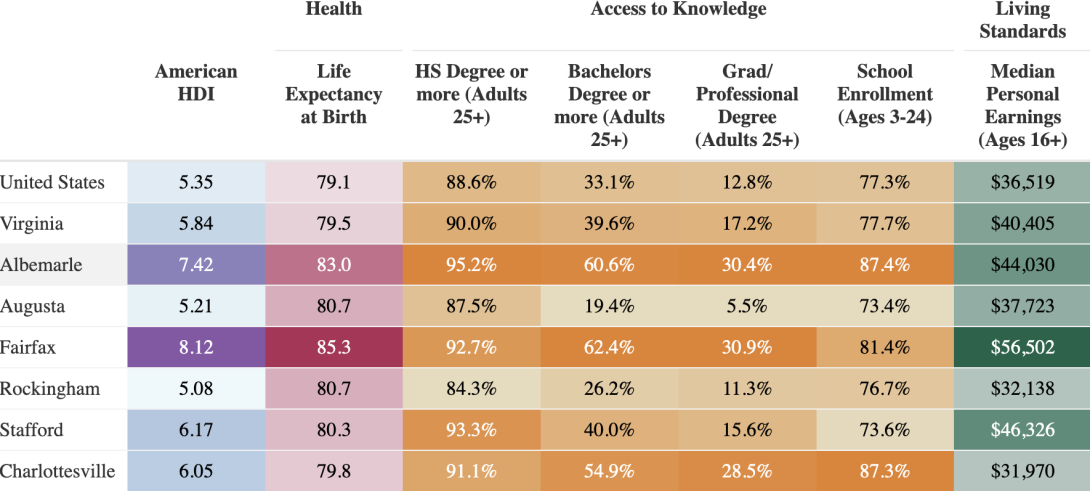
A policy tool that combines, visualizes, and makes accessible data about local disparities
virginiaequitycenter.github.io
29
Feb
resource
Feb 29, 2024
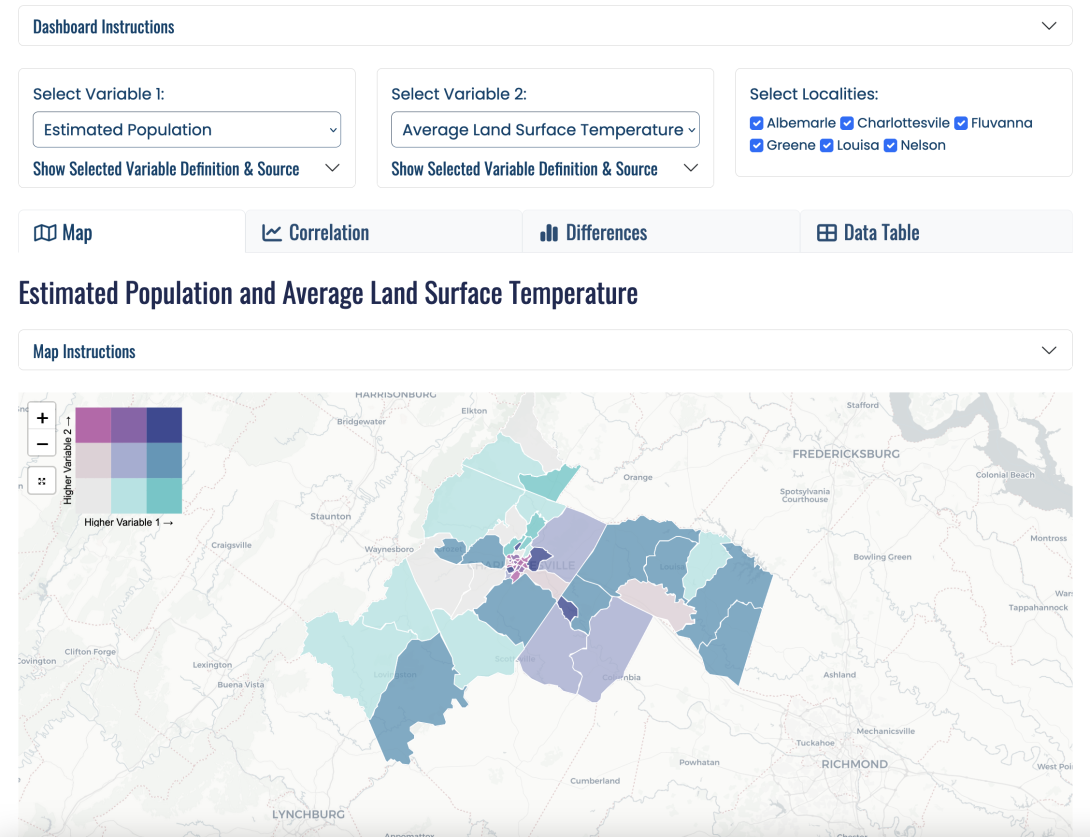
A visualization tool bringing together social, infrastructure, and climate measures
virginiaequitycenter.github.io
29
Feb
resource
Feb 29, 2024
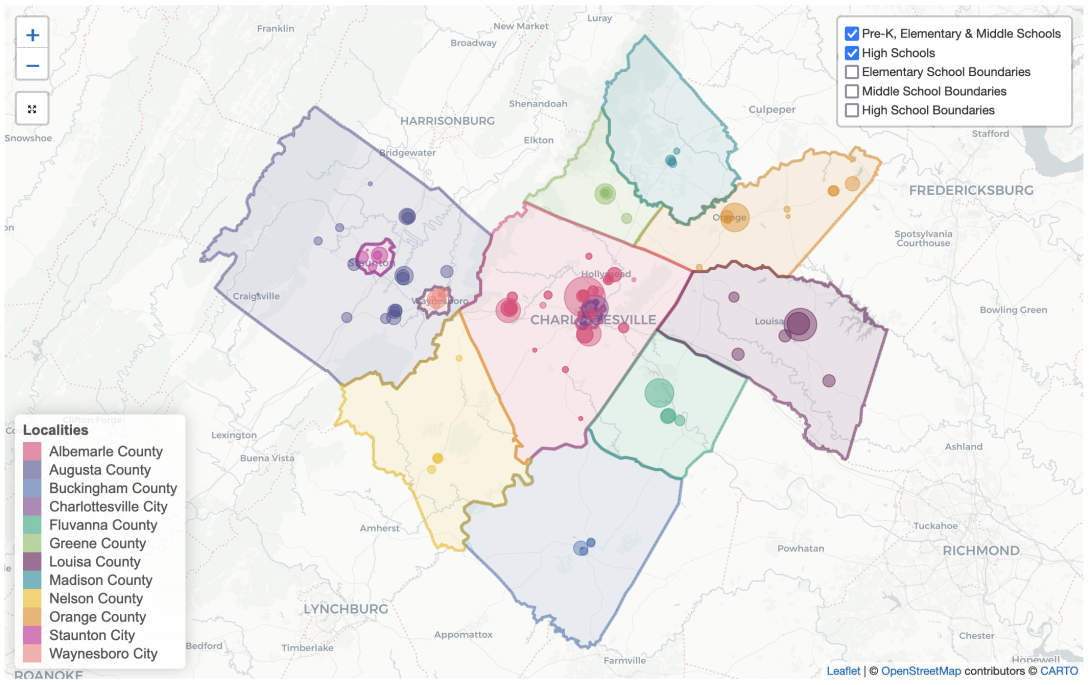
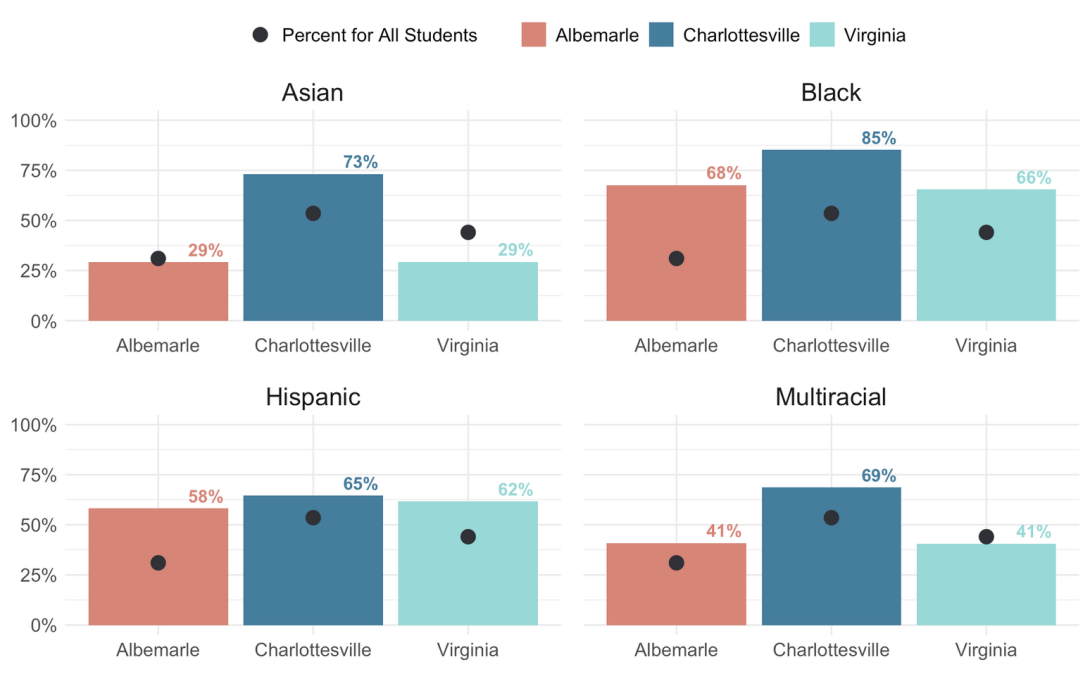
Demographic composition of local schools provided by the Virginia Department of Education
virginiaequitycenter.github.io
29
Feb
resource
Feb 29, 2024
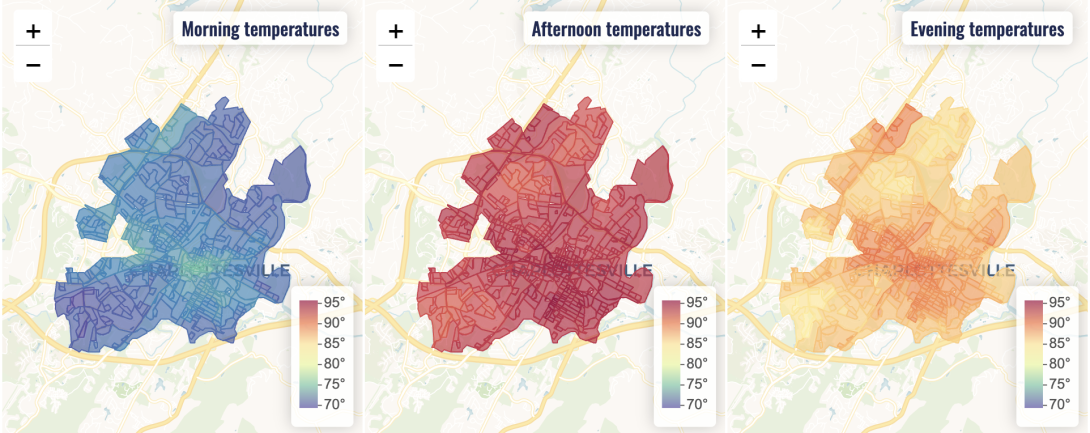
Exploring the impact of rising temperatures and tree canopy on Charlottesville neighborhoods
virginiaequitycenter.github.io
29
Feb
resource
Jun 1, 2023
An Equity Center initiative in Democratization of Data to provide tools that enable data rich advocacy in support of community building and collective action for change.
virginiaequitycenter.github.io
1
Jun
resource
Jan 11, 2024
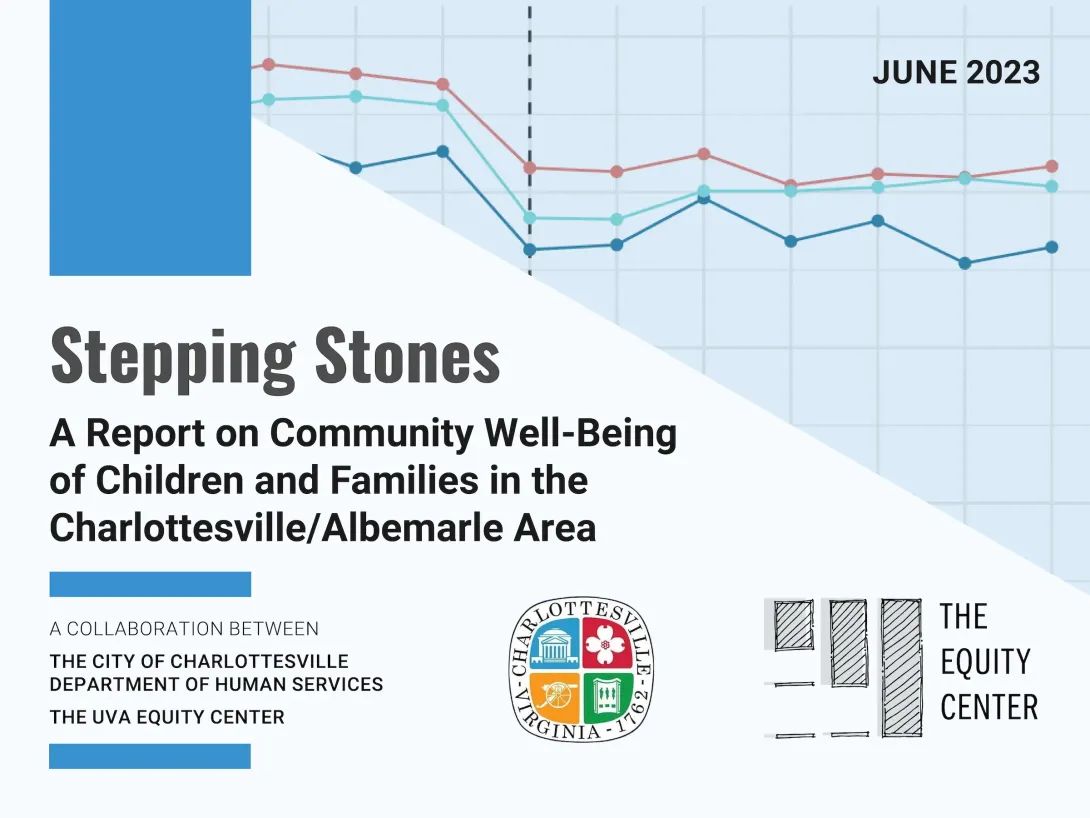
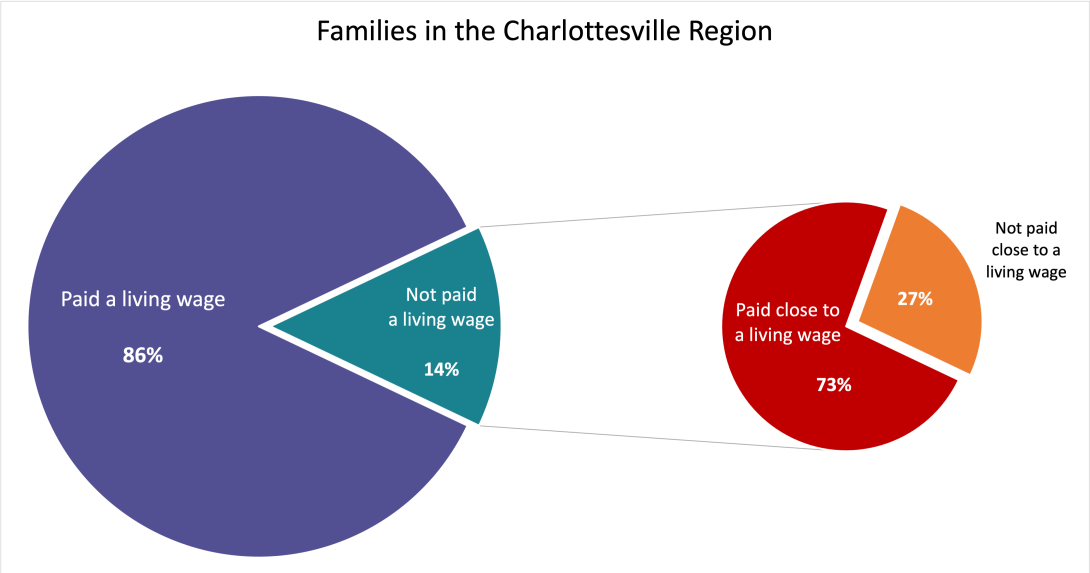
The Orange Dot Report 5.0 represents the continuation of our progress toward a more fully and equitable thriving region. Incorporating an updated description of the condition of families in our larger region, Orange Dot 5.0 marks the beginning of an annual update completed in…
virginiaequitycenter.github.io
11
Jan
News
news
| Mar 12, 2024
Mar 12, 2024
Data stories from the Equity Center:
Health outcomes in the Charlottesville region, one of three Picturing Climate Justice data stories from the Equity Center, begins with a discussion about how environmental factors connected with climate change can affect physical and mental…
www.library.virginia.edu
12
Mar
6
Feb
12
Oct
People
Equitable Analysis
Equitable Analysis centers community-driven partnership to provide advocates as well as civic-and private-sector leaders with data and metrics, contextualized analysis, interactive maps and data visualizations, and narrative storytelling.
